SmartBux Back Office
Back Office currently has two sales reports, you can run on an address. It tracks all the coins and tokens that have been sent to an address over the time period that are selected. Token prices started tracking on 7/6/2024. To run your first report start with:
1. Select the report type
2. Select the start date of the report
3. Select the hour that the report will start at. This varies depending on your business needs.
4. Select the current time zone you are in.
(Example: For a business in New York, during day light savings time choose UTC-4)
5. Enter the wallet address you want to run the report on
6. Check the tokens you want in the report.
7. Click build the report and it will display.
The reports are designed to print on a single piece of paper directly from your web browser.

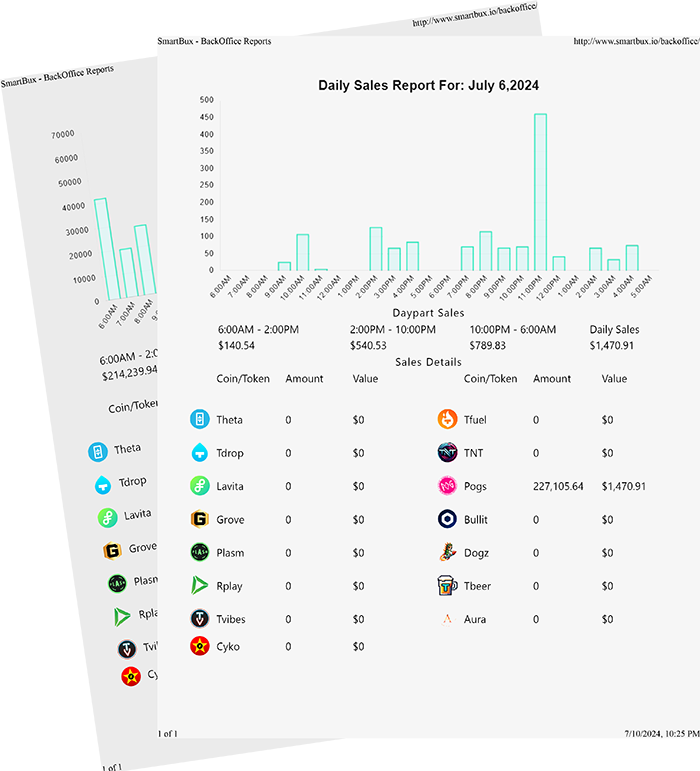
The Daily Sales Report will display the graph of all the hourly sales over a 24 hour period. Next it will show you day part sales which are broken down in 8 hours windows starting at the first hour of the report. Last it will show all the coins and tokens that an address has received along with the daily closing value of the token or coin in USD. (If you run this report on the current day it will show the current token price value.)

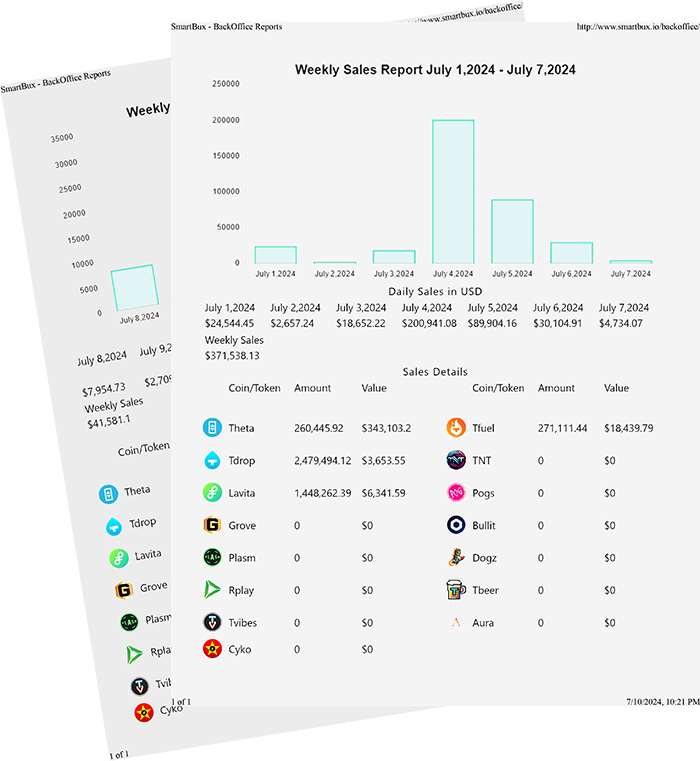
The Weekly Sales Report will display the graph of a 7 day window starting at the date selected. Next it will show you the daily sales for each day along with the total weekly sales. Last it will show all the coins and tokens that an address has received over the week, the value is calculated by the tokens recieve on a specific day multiplied by the daily closing price in USD.

